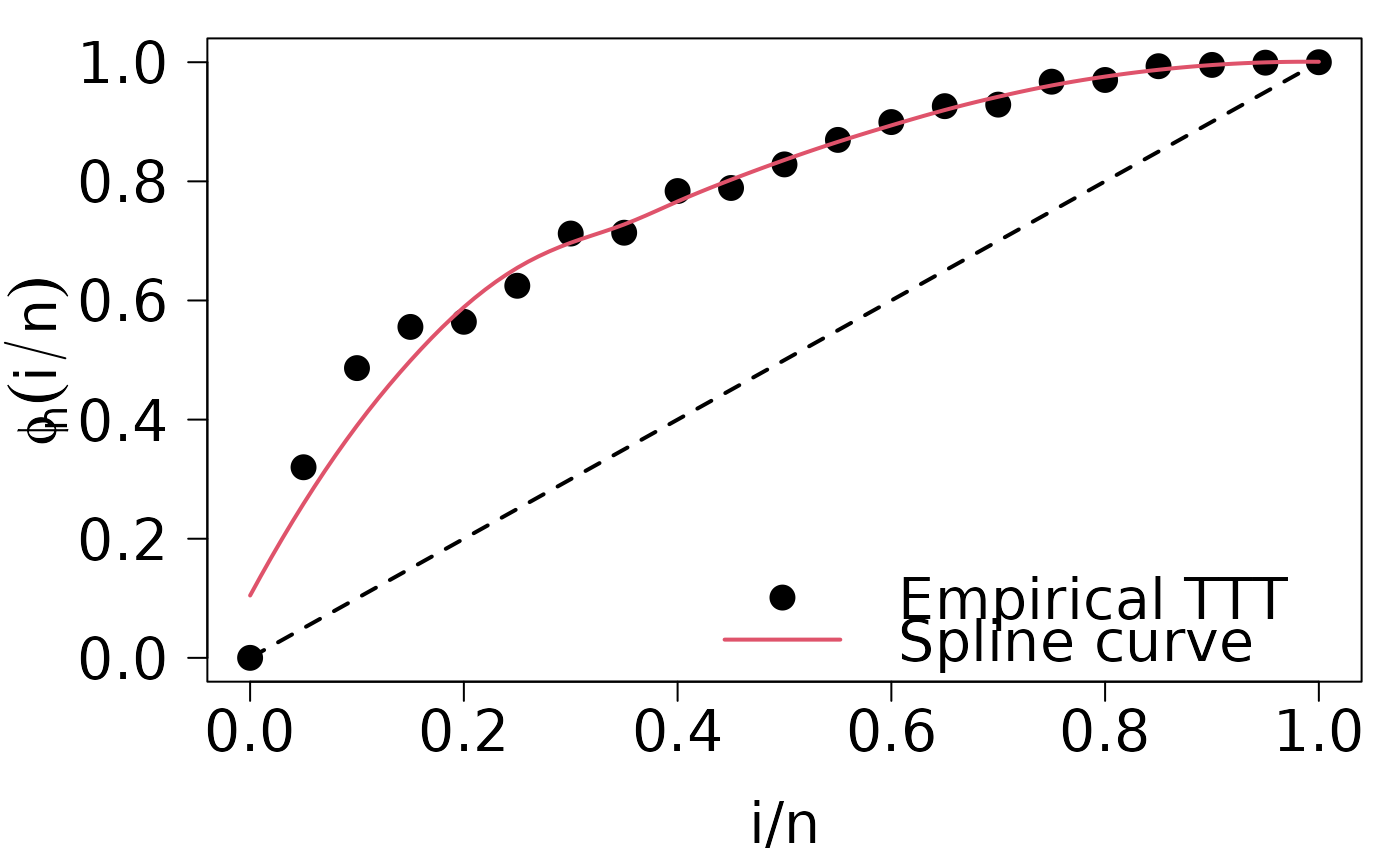
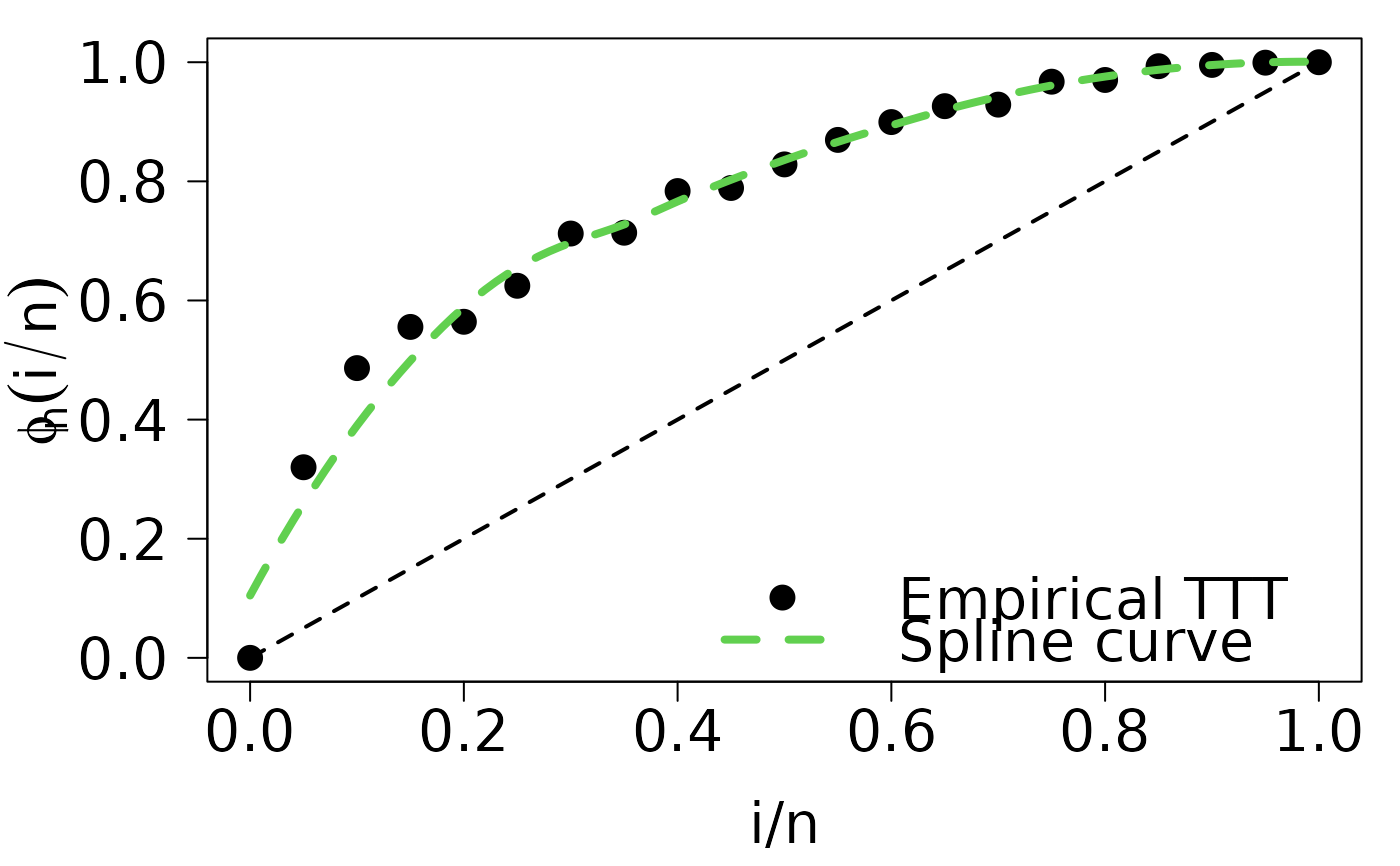
Put legend after run plot.HazardShape function.
Usage
legend.HazardShape(
  x,
  y = NULL,
  legend = c("Empirical TTT", "Spline curve"),
  fill = NULL,
  col = 1,
  border = "white",
  lty = NA,
  lwd = NA,
  pch = c(1, NA),
  angle = 45,
  density = NULL,
  bty = "o",
  bg = par("bg"),
  box.lwd = par("lwd"),
  box.lty = par("lty"),
  box.col = par("fg"),
  pt.bg = NA,
  cex = 1,
  pt.cex = cex,
  pt.lwd = lwd,
  xjust = 0,
  yjust = 1,
  x.intersp = 1,
  y.intersp = 1,
  adj = c(0, 0.5),
  text.width = NULL,
  text.col = par("col"),
  text.font = NULL,
  merge = TRUE,
  trace = FALSE,
  plot = TRUE,
  ncol = 1,
  horiz = FALSE,
  title = NULL,
  inset = 0,
  xpd = TRUE,
  title.col = text.col[1],
  title.adj = 0.5,
  title.cex = cex[1],
  title.font = text.font[1],
  seg.len = 2,
  curve_options = list(col = 2, lwd = 2, lty = 1)
)
Arguments
- x, y
the x and y co-ordinates to be used to position the legend. They can be specified by keyword or in any way which is accepted by
xy.coords: See ‘Details’.- legend
a character or expression vector of length \(\ge 1\) to appear in the legend. Other objects will be coerced by
as.graphicsAnnot.- fill
if specified, this argument will cause boxes filled with the specified colors (or shaded in the specified colors) to appear beside the legend text.
- col
the color of points or lines appearing in the legend.
- border
the border color for the boxes (used only if
fillis specified).- lty, lwd
the line types and widths for lines appearing in the legend. One of these two must be specified for line drawing.
- pch
the plotting symbols appearing in the legend, as numeric vector or a vector of 1-character strings (see
points). Unlikepoints, this can all be specified as a single multi-character string. Must be specified for symbol drawing.- angle
angle of shading lines.
- density
the density of shading lines, if numeric and positive. If
NULLor negative orNAcolor filling is assumed.- bty
the type of box to be drawn around the legend. The allowed values are
"o"(the default) and"n".- bg
the background color for the legend box. (Note that this is only used if
bty != "n".)- box.lty, box.lwd, box.col
the line type, width and color for the legend box (if
bty = "o").- pt.bg
the background color for the
points, corresponding to its argumentbg.- cex
character expansion factor relative to current
par("cex"). Used for text, and provides the default forpt.cex.- pt.cex
expansion factor(s) for the points.
- pt.lwd
line width for the points, defaults to the one for lines, or if that is not set, to
par("lwd").- xjust
how the legend is to be justified relative to the legend x location. A value of 0 means left justified, 0.5 means centered and 1 means right justified.
- yjust
the same as
xjustfor the legend y location.- x.intersp
character interspacing factor for horizontal (x) spacing between symbol and legend text.
- y.intersp
vertical (y) distances (in lines of text shared above/below each legend entry). A vector with one element for each row of the legend can be used.
- adj
numeric of length 1 or 2; the string adjustment for legend text. Useful for y-adjustment when
labelsare plotmath expressions.- text.width
the width of the legend text in x (
"user") coordinates. (Should be positive even for a reversed x axis.) Can be a single positive numeric value (same width for each column of the legend), a vector (one element for each column of the legend),NULL(default) for computing a proper maximum value ofstrwidth(legend)), orNAfor computing a proper column wise maximum value ofstrwidth(legend)).- text.col
the color used for the legend text.
- text.font
the font used for the legend text, see
text.- merge
logical; if
TRUE, merge points and lines but not filled boxes. Defaults toTRUEif there are points and lines.- trace
logical; if
TRUE, shows howlegenddoes all its magical computations.- plot
logical. If
FALSE, nothing is plotted but the sizes are returned.- ncol
the number of columns in which to set the legend items (default is 1, a vertical legend).
- horiz
logical; if
TRUE, set the legend horizontally rather than vertically (specifyinghorizoverrides thencolspecification).- title
a character string or length-one expression giving a title to be placed at the top of the legend. Other objects will be coerced by
as.graphicsAnnot.- inset
inset distance(s) from the margins as a fraction of the plot region when legend is placed by keyword.
- xpd
if supplied, a value of the graphical parameter
xpdto be used while the legend is being drawn.- title.col
color for
title, defaults totext.col[1].- title.adj
horizontal adjustment for
title: see the help forpar("adj").- title.cex
expansion factor(s) for the title, defaults to
cex[1].- title.font
the font used for the legend title, defaults to
text.font[1], seetext.- seg.len
the length of lines drawn to illustrate
ltyand/orlwd(in units of character widths).- curve_options
a list whose names are curve graphical parameters, and whose values are the corresponding graphical parameters values.
Details
This function is a wrapper for the legend function.
It just adds two features:
legendhas a default value, regarding thatHazardShapeobjects produces the TTT plot and its LOESS estimation.curve_optionsis used to set legend parameters for the LOESS curve. We encourage you to define first a list with curve parameters, and then pass it toplot.HazardShapeandlegend.HazardShape(see example 2).
Author
Jaime Mosquera Gutiérrez jmosquerag@unal.edu.co
Examples
library(EstimationTools)

data("reduction_cells")
TTT_IG <- TTTE_Analytical(Surv(days, status) ~ 1, data = reduction_cells,
                          method = 'censored')
HS_IG <- TTT_hazard_shape(TTT_IG, data = reduction_cells)

#----------------------------------------------------------------------------
# Example 1: put legend to the TTT plot of the reduction cells data set.

# Run `plot.HazardShape` method.
par(
  cex.lab=1.8,
  cex.axis=1.8,
  mar=c(4.8,5.4,1,1),
  las = 1,
  mgp=c(3.4,1,0)
)
plot(HS_IG, pch = 16, cex = 1.8)

# Finally, put the legend
legend.HazardShape(
  x = "bottomright",
  box.lwd = NA,
  cex = 1.8,
  pt.cex = 1.8,
  bty = 'n',
  pch = c(16, NA)
)

#----------------------------------------------------------------------------
# Example 2: example 1 with custom options for the curve

# This is the list with curve parameters
loess_options <- list(
  col = 3, lwd = 4, lty = 2
)
par(
  cex.lab=1.8,
  cex.axis=1.8,
  mar=c(4.8,5.4,1,1),
  las = 1,
  mgp=c(3.4,1,0)
)

plot(HS_IG, pch = 16, cex = 1.8, curve_options = loess_options)
legend.HazardShape(
  x = "bottomright",
  box.lwd = NA,
  cex = 1.8,
  pt.cex = 1.8,
  bty = 'n',
  pch = c(16, NA),
  curve_options = loess_options
)
