![[Experimental]](figures/lifecycle-experimental.svg)
Displays the estimated hazard shape given a HazardShape object.
Usage
# S3 method for class 'HazardShape'
print(x, ...)
Arguments
- x
an object of class
HazardShape, generated withTTT_hazard_shape.- ...
further arguments passed to or from other methods.
Author
Jaime Mosquera Gutiérrez jmosquerag@unal.edu.co
Examples
#--------------------------------------------------------------------------------
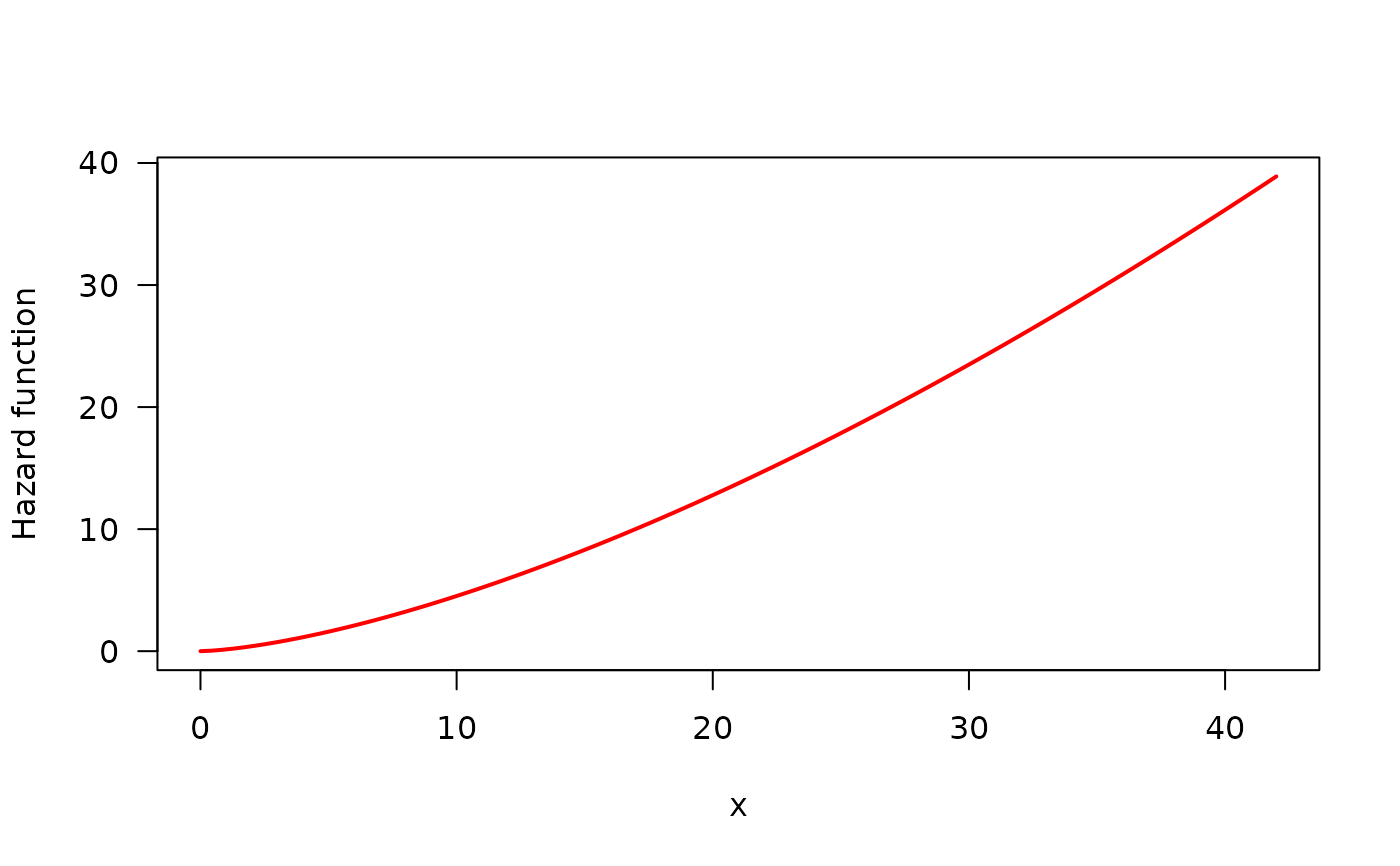
# Example 1: Increasing hazard and its corresponding TTT plot with simulated data
hweibull <- function(x, shape, scale){
dweibull(x, shape, scale)/pweibull(x, shape, scale, lower.tail = FALSE)
}
curve(hweibull(x, shape = 2.5, scale = pi), from = 0, to = 42,
col = "red", ylab = "Hazard function", las = 1, lwd = 2)
 y <- rweibull(n = 50, shape = 2.5, scale = pi)
my_initial_guess <- TTT_hazard_shape(formula = y ~ 1)
print(my_initial_guess)
#> --------------------------------------------------------------------
#> Hazard shape: Increasing
#> --------------------------------------------------------------------
#> Warning: Non-parametric estimate for Empirical TTT is irregular.
#> Please, use the 'plot()' method to see the TTT shape
#--------------------------------------------------------------------------------
y <- rweibull(n = 50, shape = 2.5, scale = pi)
my_initial_guess <- TTT_hazard_shape(formula = y ~ 1)
print(my_initial_guess)
#> --------------------------------------------------------------------
#> Hazard shape: Increasing
#> --------------------------------------------------------------------
#> Warning: Non-parametric estimate for Empirical TTT is irregular.
#> Please, use the 'plot()' method to see the TTT shape
#--------------------------------------------------------------------------------