![[Deprecated]](figures/lifecycle-deprecated.svg)
This function displays the estimated hazard shape given a data set.
Arguments
- object
an object of class
HazardShape, generated withTTT_hazard_shape.
Author
Jaime Mosquera Gutiérrez jmosquerag@unal.edu.co
Examples
#--------------------------------------------------------------------------------
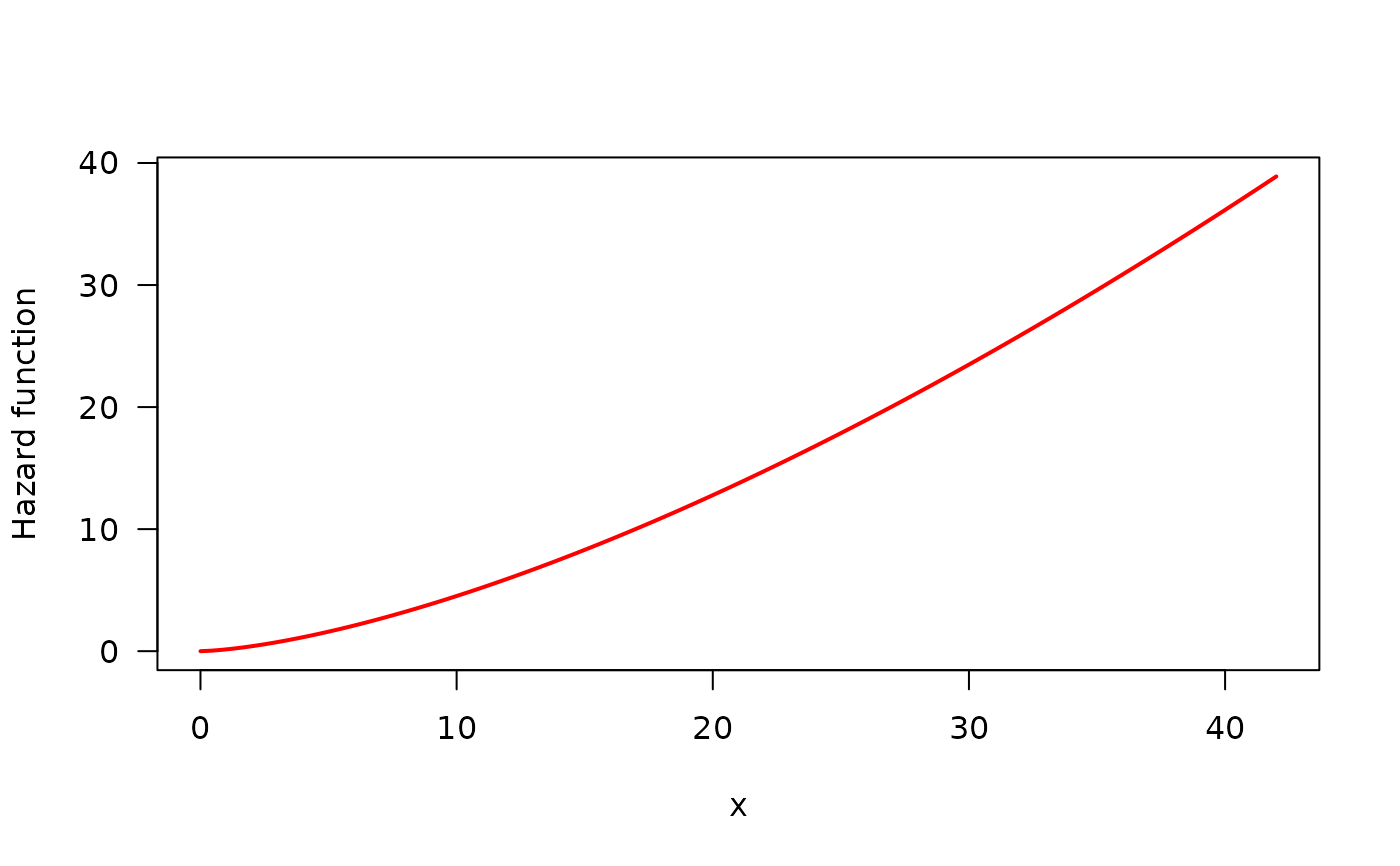
# Example 1: Increasing hazard and its corresponding TTT plot with simulated data
hweibull <- function(x, shape, scale){
dweibull(x, shape, scale)/pweibull(x, shape, scale, lower.tail = FALSE)
}
curve(hweibull(x, shape = 2.5, scale = pi), from = 0, to = 42,
col = "red", ylab = "Hazard function", las = 1, lwd = 2)
 y <- rweibull(n = 50, shape = 2.5, scale = pi)
my_initial_guess <- TTT_hazard_shape(formula = y ~ 1)
Hazard_Shape(my_initial_guess)
#> Warning: `Hazard_Shape()` was deprecated in EstimationTools 2.2.0.
#> ℹ Please use `print.HazardShape()` instead.
#> --------------------------------------------------------------------
#> Hazard shape: Increasing
#> --------------------------------------------------------------------
#> Successful estimate!
#--------------------------------------------------------------------------------
y <- rweibull(n = 50, shape = 2.5, scale = pi)
my_initial_guess <- TTT_hazard_shape(formula = y ~ 1)
Hazard_Shape(my_initial_guess)
#> Warning: `Hazard_Shape()` was deprecated in EstimationTools 2.2.0.
#> ℹ Please use `print.HazardShape()` instead.
#> --------------------------------------------------------------------
#> Hazard shape: Increasing
#> --------------------------------------------------------------------
#> Successful estimate!
#--------------------------------------------------------------------------------